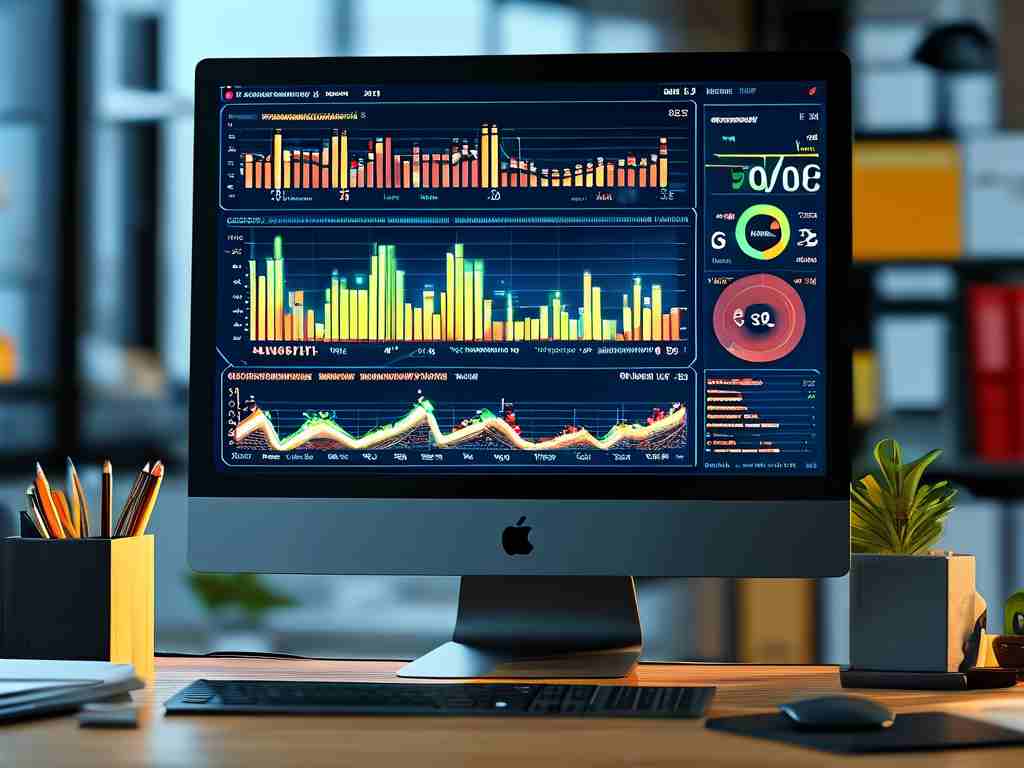
In modern software development and system administration, understanding the relationship between memory usage and time efficiency is critical for optimizing performance. This article explores practical methods to calculate time-related metrics while monitoring memory consumption, offering actionable insights for developers and IT professionals.

The Importance of Memory-Time Correlation
Memory leaks, inefficient algorithms, and resource-heavy processes often manifest as gradual performance degradation. By correlating memory usage patterns with time intervals, teams can identify bottlenecks. For instance, a process that consumes 10% more RAM every hour might indicate a memory leak, while spikes in usage during specific operations could highlight inefficient code segments.
Key Metrics to Track
- Memory Utilization Over Time: Tools like Python's
memory_profileror Linux'ssmemtrack memory allocation at timed intervals. For example:from memory_profiler import memory_usage import time
def sample_function():
data = [i**2 for i in range(100000)]
time.sleep(2)
return data
mem_usage = memory_usage((sample_function, (), {}), interval=0.5)
print(f"Peak memory: {max(mem_usage)} MB")
This code measures memory consumption every 0.5 seconds during the function's execution, linking usage to specific time windows.

2. **Time-Weighted Averages**: Calculate average memory usage per minute/hour to detect trends. A server showing 80% average memory usage over 24 hours may require scaling, even if short-term spikes seem manageable.

### Tools for Combined Analysis
Platforms like Prometheus with Grafana visualize memory-time relationships through dashboards. By configuring queries like `rate(node_memory_Active_bytes[5m])`, teams observe how memory usage evolves per unit of time. Similarly, Java’s VisualVM combines heap analysis with timeline views to pinpoint garbage collection inefficiencies.

### Case Study: Real-Time Data Processing
A streaming service noticed latency spikes during peak hours. By graphing memory usage against request processing times, engineers discovered a correlation: when memory exceeded 75%, response times doubled. Adjusting buffer sizes and optimizing thread pooling reduced memory pressure, cutting latency by 40%.

### Calculating Efficiency Ratios
To quantify improvements, use formulas like **Memory-Time Product (MTP)**:
\[ \text{MTP} = \frac{\text{Total Memory Used (GB)} \times \text{Time Elapsed (hours)}}}{\text{Number of Tasks Completed}} \]
Lower MTP values indicate better efficiency. For instance, reducing MTP from 12 to 8 after code refactoring shows tangible optimization.

### Challenges and Solutions
- **Short-Term vs. Long-Term Analysis**: High-frequency monitoring (e.g., per-second checks) captures transient issues but generates large datasets. Aggregate logs into 5-minute summaries for balance.
- **Clock Skew in Distributed Systems**: Use synchronized timestamps via NTP or tools like OpenTelemetry to align memory metrics across servers.

### Future Trends
Machine learning models now predict memory needs based on historical time-series data, enabling proactive allocation. Projects like Facebook’s “Memory Advisor” analyze usage patterns to recommend optimizations before crashes occur.

###
Effectively calculating time-related metrics during memory monitoring requires strategic tool selection and data interpretation. By integrating these practices, organizations preempt performance issues, reduce downtime, and deliver smoother user experiences. Regularly audit systems and experiment with profiling tools to stay ahead in an era where every megabyte and millisecond counts.


