In today’s digitally driven world, grasping the fundamentals of computer networks is essential for both professionals and enthusiasts. This article uses visual analysis to break down core concepts, helping readers build a clear mental model of how data flows across interconnected systems.
The Architecture of Modern Networks
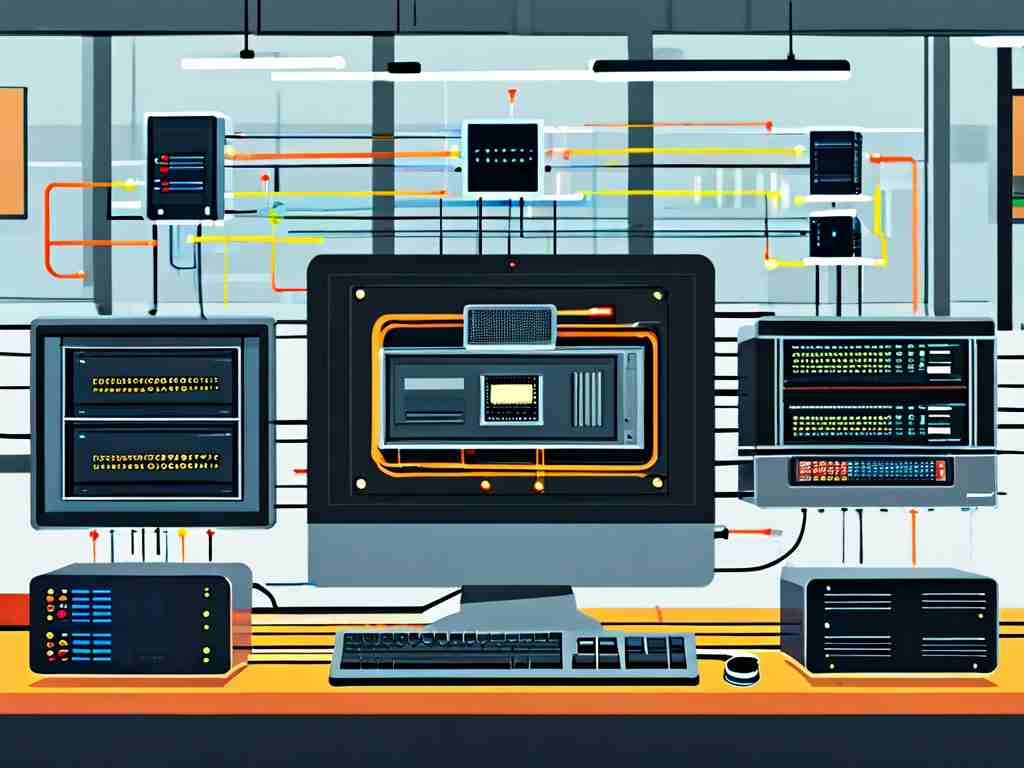
At its core, a computer network is a collection of devices (nodes) linked by communication channels. A simplified diagram often reveals three key components:
- End Devices: Computers, smartphones, and servers that generate or consume data.
- Intermediate Devices: Routers, switches, and hubs that direct traffic.
- Transmission Media: Wired (Ethernet, fiber optics) or wireless (Wi-Fi, Bluetooth) pathways.
Visualizing these elements highlights the layered structure of networks. For instance, the OSI (Open Systems Interconnection) model divides communication into seven abstraction layers, each handling specific tasks. A diagram of this model shows how data moves from the application layer (user-facing software) down to the physical layer (hardware signals), with headers added or removed at each stage.
Data Transmission Demystified
A critical aspect of network analysis is understanding packet switching. Imagine a flowchart where a large file—say, a video—is split into smaller "packets." Each packet travels independently across the network, potentially taking different routes. At the destination, packets are reassembled in order. This method ensures efficient bandwidth usage and fault tolerance.
To illustrate, consider a simple network topology with two routers connecting three subnets. A traceroute visualization would show the path packets take from a laptop in Subnet A to a server in Subnet C, passing through Router 1 and Router 2. Latency spikes or packet loss at specific hops can pinpoint bottlenecks.
Protocols in Action
Protocols like TCP/IP form the backbone of internet communication. A sequence diagram of a TCP handshake—SYN, SYN-ACK, ACK—reveals how devices establish reliable connections. Meanwhile, UDP (User Datagram Protocol) skips error-checking steps for faster transmission, ideal for live streaming or gaming.
For example, Wireshark captures (screenshots included below) demonstrate HTTP requests and responses. A GET request sent from a browser to a web server triggers a cascade of DNS lookups, TCP negotiations, and data transfers—all visible in packet details.
Sample HTTP Request Capture:
Frame 123: 74 bytes on wire
Ethernet II: 00:1A:2B:3C:4D:5E → 00:0F:1E:2D:3C:4B
IP: 192.168.1.10 → 203.0.113.5
TCP: [SYN] Seq=0 Win=64240 Len=0
Security and Threats
Network diagrams also expose vulnerabilities. A firewall configuration chart might show inbound/outbound rules blocking unauthorized ports. Conversely, a man-in-the-middle attack diagram depicts hackers intercepting unencrypted traffic between a user and a router.
Encryption protocols like HTTPS and VPNs add "tunnels" to these visuals, transforming clear-text data into ciphertext. For instance, an SSL/TLS handshake flowchart emphasizes certificate validation and key exchange processes that protect sensitive information.
Practical Applications
Case studies reinforce these concepts. A small office network setup might combine a hardware firewall, a Layer 3 switch for VLAN segmentation, and wireless access points. Monitoring tools like Nagios or PRTG generate traffic heatmaps, highlighting peak usage times or suspicious activity.
In summary, visual tools transform abstract networking theories into tangible insights. Whether analyzing packet flows, optimizing infrastructure, or thwarting cyber threats, diagrams serve as universal translators for complex systems. By pairing these visuals with hands-on experiments—such as configuring a home lab router or simulating networks in Cisco Packet Tracer—readers gain both knowledge and practical skills.