Understanding how computer memory usage is calculated is crucial for optimizing system performance, diagnosing issues, and ensuring efficient resource allocation. Memory usage refers to the amount of RAM (Random Access Memory) consumed by running processes, applications, and the operating system itself. Accurately measuring this helps prevent slowdowns, crashes, and bottlenecks in daily computing tasks. There are several methods to calculate memory usage, each varying in complexity, accessibility, and the level of detail they provide. This article explores these approaches in depth, offering practical insights for users across different platforms.

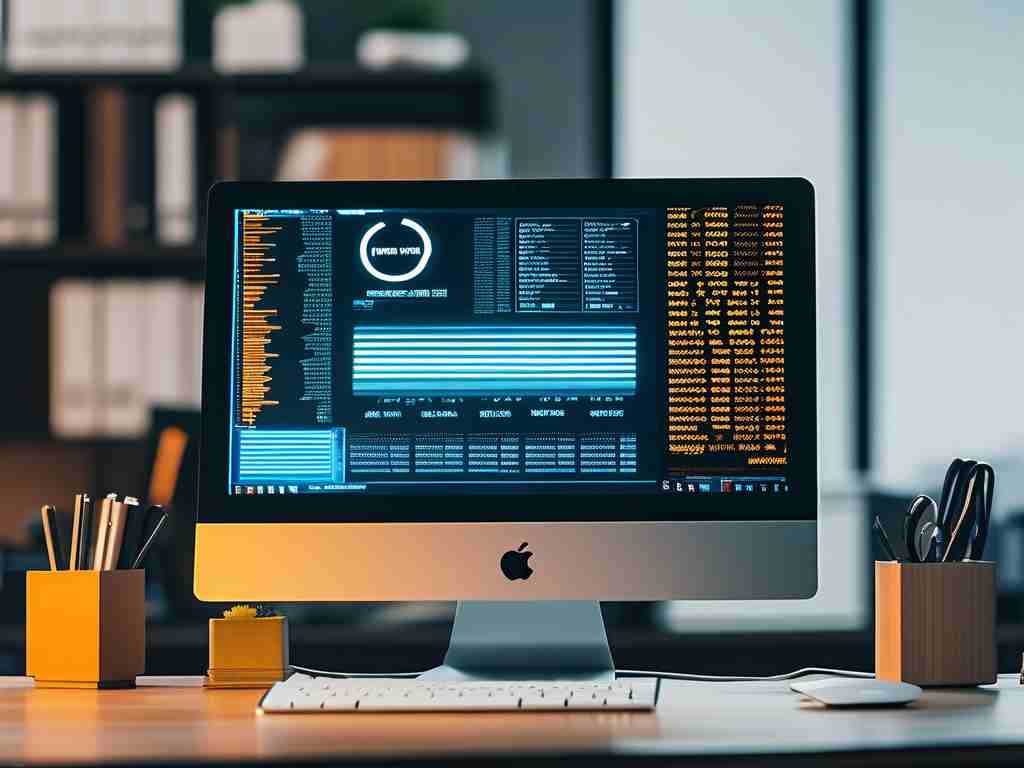
One primary method involves using built-in operating system tools, which are readily available and user-friendly. For instance, in Windows, the Task Manager provides a straightforward way to view memory consumption. By pressing Ctrl+Shift+Esc, users can access the Performance tab to see real-time graphs of memory usage, including details like committed memory and cached data. Similarly, on macOS, the Activity Monitor (found in Utilities) displays memory pressure and app-specific usage through intuitive visuals. Linux distributions often feature tools like GNOME System Monitor, which offer graphical representations of RAM utilization. These tools calculate memory usage by aggregating data from kernel-level statistics, providing a high-level overview without requiring technical expertise. While they excel for quick checks, they may lack granularity for advanced troubleshooting.
Another effective approach is leveraging command-line utilities, especially popular in Unix-based systems like Linux and macOS. These tools deliver precise calculations through terminal commands, making them ideal for scripting and automation. A common example is the 'free' command in Linux, which outputs total, used, and free memory in kilobytes or megabytes. Running 'free -m' shows a snapshot, and adding flags like '-s' enables continuous monitoring. Similarly, 'top' or 'htop' provides dynamic, process-level details, updating in real-time to show memory percentages and resident set sizes. For deeper analysis, 'vmstat' reports virtual memory statistics, including swap usage, which indirectly affects overall memory calculations. These utilities work by querying system files like /proc/meminfo, ensuring accuracy through direct kernel access. Although command-line methods demand some familiarity, they empower users with customizable, low-overhead calculations for server or development environments.
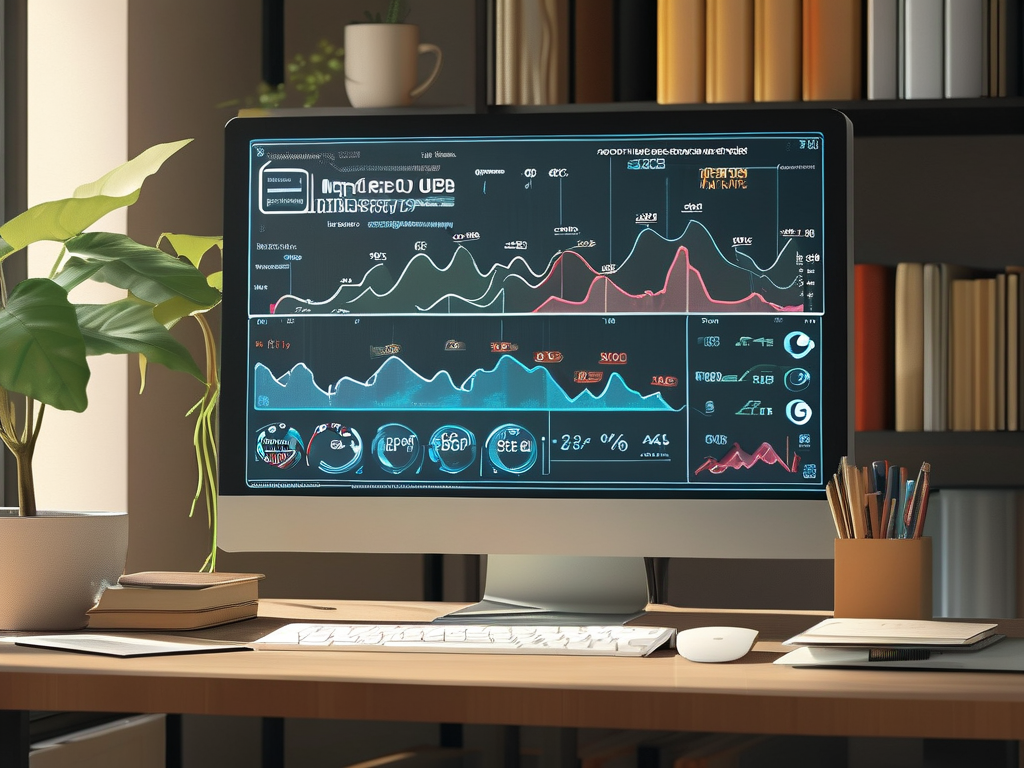
Third-party software offers another dimension to memory usage calculation, often enhancing features beyond native tools. Applications like Process Explorer for Windows or sysstat for Linux provide detailed visualizations, historical tracking, and alerts for abnormal memory spikes. These tools calculate usage by integrating APIs and system calls, compiling data into user-friendly dashboards. For example, Process Explorer displays per-process memory consumption with color-coded graphs, helping identify memory leaks in applications. Cloud-based monitors like Datadog or New Relic extend this to networked systems, aggregating memory metrics across multiple devices for enterprise-scale analysis. While these solutions typically require installation and may involve costs for premium features, they excel in delivering comprehensive insights through advanced algorithms that correlate memory usage with CPU and disk activity.
Programming-based methods allow for customized memory calculation through code, suitable for developers and automated systems. Using libraries like Python's psutil, one can write scripts to retrieve and process memory data programmatically. A simple code snippet demonstrates this: import psutil; memory = psutil.virtual_memory(); print(f"Used memory: {memory.used / (1024**2):.2f} MB"). This accesses system APIs to fetch metrics like total, available, and percentage used RAM. In languages like C, system calls such as sysinfo() on Linux provide low-level access for embedded systems. These methods calculate memory usage by directly interfacing with the operating system's memory management units, enabling real-time logging or integration into larger applications. They offer flexibility but require coding skills to handle errors and optimize for performance.
In , calculating computer memory usage encompasses a range of methods, from simple OS tools to advanced programming techniques. Each approach serves different needs: built-in utilities for quick checks, command-line for precision, third-party apps for depth, and code-based solutions for customization. By selecting the right method, users can maintain system health and boost efficiency. Always consider factors like platform compatibility and required detail level when choosing a calculation method for optimal results.