As enterprises increasingly adopt hybrid cloud environments, monitoring solutions must evolve to address distributed infrastructure complexities. This article explores a visualized hybrid cloud monitoring framework through architectural diagrams, complete with practical implementation strategies and code snippets.]

The Growing Need for Hybrid Observability
With 72% of organizations now using mixed infrastructure according to Flexera's 2023 cloud report, traditional monitoring tools struggle with visibility gaps between on-premises systems and multiple cloud platforms. A well-designed monitoring architecture bridges these silos through three core layers:
- Data Collection Tier
Agents and APIs form the foundation, gathering metrics from diverse sources. For containerized workloads, consider this Prometheus exporter configuration:scrape_configs:
- job_name: 'azure-vms'
azure_sd_configs:
- subscription_id: "SUB-123" tenant_id: "TENANT-456"
- job_name: 'on-prem-servers'
file_sd_configs:
- files: ['/targets/nodes.yml']
This setup enables unified metric collection across Azure VMs and physical servers, using both cloud-native discovery and file-based targets.
- files: ['/targets/nodes.yml']
Intelligent Correlation Engine
The middle layer processes telemetry data using machine learning pipelines. Tools like Elasticsearch's Logstash help normalize different data formats:
filter {
  if [cloud] == "aws" {
    mutate { add_field => { "region" => "%{[ec2][availability_zone]}" } }
  }
  else if [cloud] == "onprem" {
    grok { match => { "host" => "%{IP:private_ip}" } }
  }
}
This code snippet demonstrates conditional field mapping for AWS EC2 instances versus on-premises servers, ensuring consistent metadata across environments.
Visualization and Automation Layer
Modern dashboards must display hybrid infrastructure as a unified entity. Grafana's plugin system enables consolidated views:
SELECT
  mean("cpu_usage")
FROM "autogen"."metrics"
WHERE ("cloud" = 'azure' OR "cloud" = 'vmware')
GROUP BY time(1m), "host"
This InfluxQL query combines Azure and VMware metrics in a single visualization, eliminating the need for platform-specific dashboards.
Implementation Challenges and Solutions
Network segmentation creates visibility barriers in hybrid environments. A relay-based architecture using open-source tools demonstrates this solution:
# Network proxy for restricted zones
from flask import Flask, jsonify
app = Flask(__name__)

@app.route('/metrics')
def forward_metrics():
    internal_metrics = collect_from_secure_zone()
    return jsonify(internal_metrics)
This Python proxy collects metrics from air-gapped networks while maintaining security boundaries.
Cost Optimization Techniques
Hybrid monitoring generates massive data volumes. Implement tiered storage with retention policies:
# Curl command for Elasticsearch ILM policy
curl -X PUT "localhost:9200/_ilm/policy/hybrid_data" -H 'Content-Type: application/json' -d'
{
  "policy": {
    "phases": {
      "hot": {"actions": {"rollover": {"max_size": "50gb"}}},
      "delete": {"min_age": "365d", "actions": {"delete": {}}}
    }
  }
}
'
This Elasticsearch Index Lifecycle Management policy automatically archives older data to cold storage.
Future-Proofing Your Architecture
Emerging technologies like eBPF (Extended Berkeley Packet Filter) are reshaping hybrid monitoring. Kernel-level observability tools provide deeper insights without agent installations:
// eBPF program for cross-cloud traffic monitoring
SEC("kprobe/tcp_sendmsg")
int trace_tcp_out(struct pt_regs *ctx) {
    struct sock *sk = (struct sock *)PT_REGS_PARM1(ctx);
    // Extract connection metadata
    bpf_probe_read(&dport, sizeof(dport), &sk->sk_dport);
    // Send to userspace collector
    bpf_perf_event_output(ctx, &events, BPF_F_CURRENT_CPU, &data, sizeof(data));
    return 0;
}
This C code sample illustrates low-level network monitoring applicable across any environment.
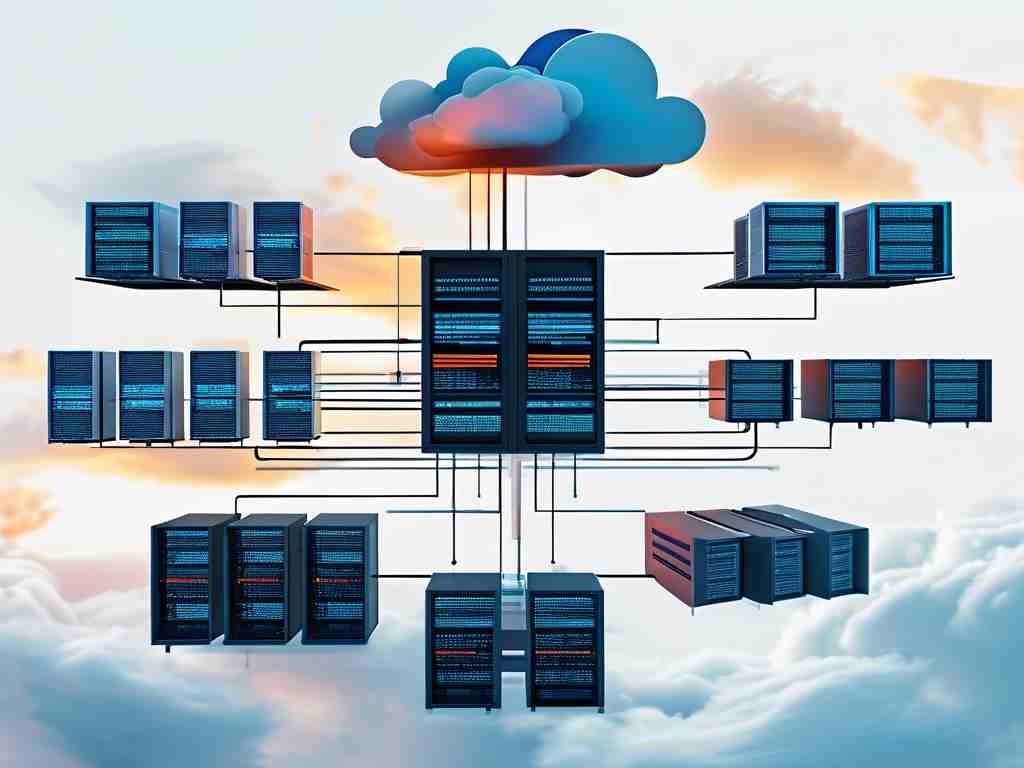
The architectural diagram below summarizes key components:

Fig.1 Integrated monitoring workflow spanning public clouds and private data centers
By implementing this visualized framework, organizations achieve true cross-environment observability while maintaining flexibility for future cloud migrations. Regular architecture reviews every 6-9 months ensure alignment with evolving technologies like edge computing and serverless platforms.