The rapid adoption of hybrid cloud environments has created a pressing need for robust monitoring solutions that span both on-premises and public cloud infrastructures. A well-designed hybrid cloud monitoring system architecture ensures visibility, performance optimization, and rapid incident response across distributed resources. This article explores the core components and design principles of such a system, emphasizing practical implementation strategies.

Core Components of the Architecture
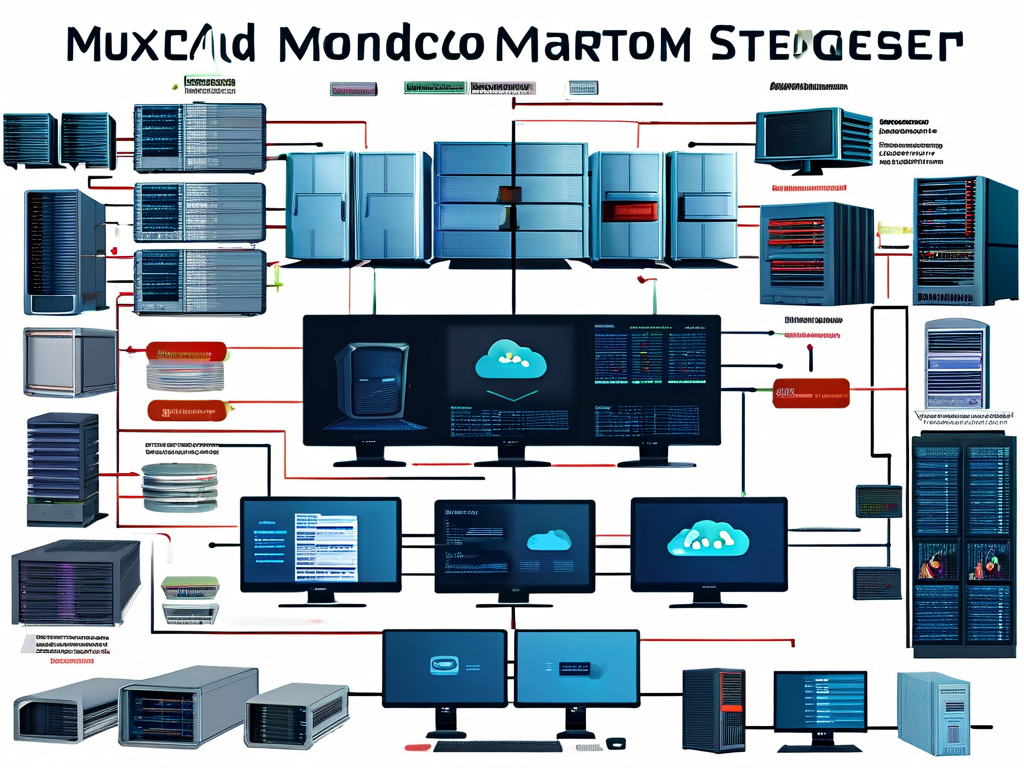
A hybrid cloud monitoring system typically comprises four layers: data collection, processing and analysis, storage, and visualization/alerting.
- Data Collection Layer
This layer aggregates metrics, logs, and traces from diverse sources, including virtual machines, containers, serverless functions, and network devices. Tools like Telegraf, Prometheus exporters, and custom agents are deployed to collect data uniformly. For example, a Kubernetes cluster in a public cloud might use the following Prometheus configuration snippet to scrape metrics:scrape_configs:
- job_name: 'kubernetes-pods'
kubernetes_sd_configs:
- role: pod relabel_configs:
- source_labels: [__meta_kubernetes_pod_annotation_prometheus_io_scrape]
action: keep
regex: true
Meanwhile, on-premises legacy systems might rely on SNMP or API-based integrations.
-
Processing and Analysis Layer
Raw data is normalized, enriched, and analyzed here. Stream-processing frameworks like Apache Kafka or AWS Kinesis handle real-time data pipelines, while batch-processing tools (e.g., Spark) manage historical analysis. Anomaly detection algorithms and correlation engines identify issues such as resource contention or latency spikes. -
Storage Layer
Time-series databases (TSDB) like InfluxDB or TimescaleDB store metrics for fast querying, while object storage (e.g., Amazon S3) retains logs and traces cost-effectively. Multi-region replication ensures data resilience in hybrid setups. -
Visualization and Alerting Layer
Dashboards in Grafana or Datadog provide cross-cloud visibility, and tools like PagerDuty trigger alerts based on threshold breaches or anomaly scores. Role-based access controls (RBAC) limit data exposure across teams.
Key Design Considerations
- Unified Telemetry: Standardizing data formats (OpenTelemetry) avoids vendor lock-in and simplifies cross-platform analysis.
- Scalability: The architecture must handle bursts in data volume during incidents or auto-scaling events.
- Security: Encrypted data transit (TLS) and zero-trust authentication (OAuth2, SPIFFE) protect sensitive metrics.
- Cost Optimization: Tiered storage policies and data sampling reduce expenses without compromising insights.
Challenges and Mitigations
Network latency between on-premises and cloud components can delay alerting. Deploying edge gateways with local caching and preprocessing mitigates this. Additionally, inconsistent monitoring coverage for legacy systems often requires custom adapters or middleware.
Case Study: Financial Services Implementation
A multinational bank implemented a hybrid monitoring system using Elastic Stack for log aggregation and Thanos for multi-cluster Prometheus metrics. By integrating Azure Arc for on-premises resource management, they achieved 360-degree visibility, reducing mean time to resolution (MTTR) by 40%.
Future Trends
Emergent technologies like AIOps and eBPF-based observability will further refine hybrid cloud monitoring. However, the foundational architecture discussed here remains critical for operational reliability.
In , a thoughtfully crafted hybrid cloud monitoring system architecture bridges the gap between disparate environments, enabling organizations to harness cloud flexibility while maintaining control. By prioritizing modularity, security, and scalability, businesses can future-proof their observability strategies.