Modern computers occasionally suffer from unexpectedly high memory consumption, causing sluggish performance and operational disruptions. Understanding the root causes empowers users to optimize system resources effectively. This article explores practical scenarios and technical explanations behind memory-hogging behaviors while offering actionable insights.

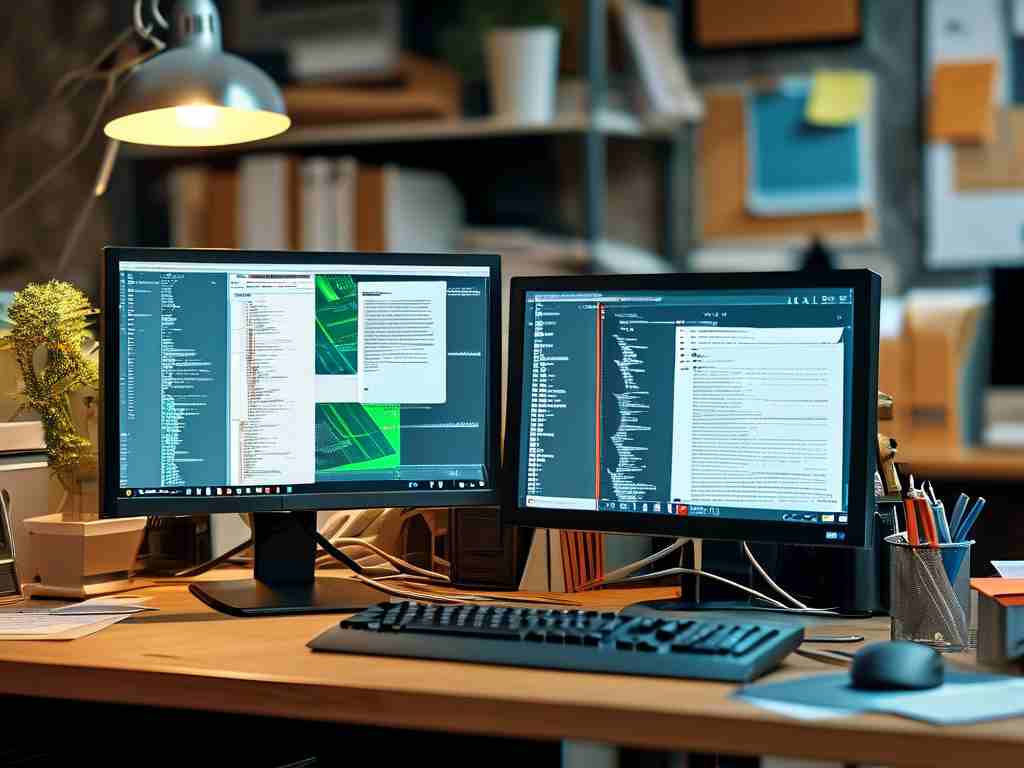
One primary culprit involves background processes and services. Operating systems automatically run numerous background tasks – from automatic updates to indexing services. A single inactive application like a web browser might retain multiple subprocesses that collectively consume hundreds of megabytes. Third-party software exacerbates this issue; for instance, a poorly optimized video editor might allocate RAM for preview rendering even when minimized. Users can identify these stealthy consumers through built-in tools like Windows Task Manager or macOS Activity Monitor, where sorting processes by memory usage reveals hidden resource drains.
Memory leaks represent another critical factor, particularly in long-running applications. These occur when programs fail to release allocated memory after completing tasks. A document editing app might gradually consume more RAM with each auto-save operation due to flawed cleanup routines. Developers often patch such issues through updates, making regular software maintenance crucial. Notable examples include early versions of popular games that exhibited progressive memory accumulation during extended play sessions, requiring periodic restarts to mitigate performance degradation.
Malware infections frequently manifest as abnormal memory usage. Cryptocurrency mining scripts or spyware tools operate covertly, hijacking system resources. Unlike legitimate software, these malicious programs intentionally avoid detection by mimicking system processes. A sudden 30% memory increase without corresponding user activity could indicate such threats. Robust antivirus solutions combined with network monitoring tools help identify these intruders, though some advanced persistent threats (APTs) may require specialized removal tools.
The multitasking paradox also contributes significantly. While modern operating systems employ memory compression and swapping mechanisms, exceeding physical RAM capacity forces reliance on slower disk-based virtual memory. Opening 50 browser tabs while running a virtual machine and design software might push total memory demands beyond available resources. This triggers constant data shuffling between RAM and storage devices, observable through persistent disk activity lights or audible hard drive noises in older systems.
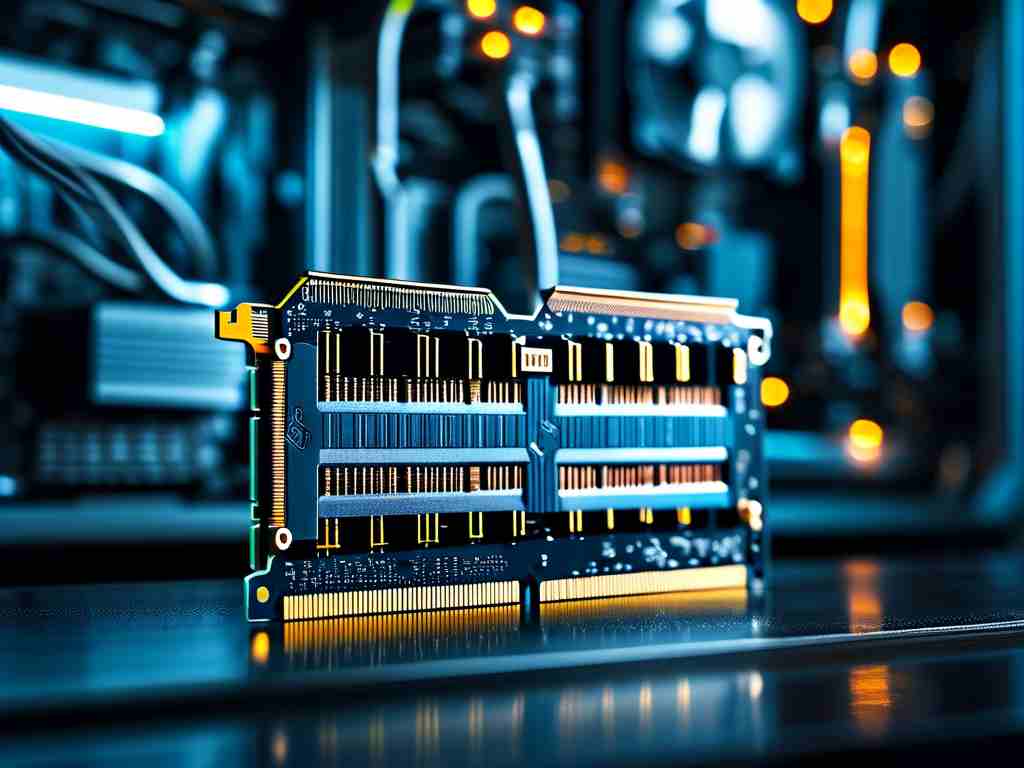
Hardware limitations create fundamental constraints. A machine with 4GB RAM running Windows 11 and multiple modern applications will inevitably struggle, as the OS alone requires 2-3GB for basic operations. Memory-intensive tasks like video editing or machine learning workflows demand proportionally more resources. Users working with large datasets in Excel or complex 3D models in CAD software often encounter abrupt performance cliffs when approaching hardware limits.
Software architecture plays an underappreciated role. Electron-based applications like Slack or Discord package entire web browsers within their desktop clients, sometimes consuming 500MB-1GB per instance. Similarly, Java applications rely on JVM memory pools that may not efficiently scale with workload demands. Developers balancing cross-platform compatibility with resource efficiency frequently face these trade-offs.
Resolution strategies involve both proactive and reactive measures. Regularly auditing startup programs through system configuration utilities prevents unnecessary memory allocation from boot. For developers, implementing proper garbage collection and memory profiling during software testing prevents leakage issues. Hardware upgrades remain the definitive solution for persistent bottlenecks – doubling RAM capacity often yields immediate improvements for memory-constrained systems.
Advanced users might explore memory optimization tools like Intelligent Standby List Cleaner (ISLC) for Windows or custom kernel parameters on Linux systems. These utilities help manage memory caching behaviors, though improper configuration risks system instability. Browser extensions like The Great Suspender automatically freeze inactive tabs, recovering substantial memory without losing workspace context.
In enterprise environments, IT departments deploy centralized monitoring solutions like Nagios or Zabbix to track memory usage patterns across networked devices. Cloud-based systems utilize auto-scaling features that dynamically adjust allocated resources based on real-time demand, though this approach introduces cost management challenges.
Ultimately, balancing memory usage requires understanding both technological constraints and usage patterns. A graphic designer’s workstation has different optimization needs compared to a server handling database queries. By combining system monitoring, software updates, and strategic hardware investments, users can maintain optimal memory utilization across various computing scenarios.